
Since everyone appears to have been in auroral fever mode following the sighting of a Coronal Mass Ejection by both the Solar Dynamics Observatory and SoHO, I might as well add my tuppence.
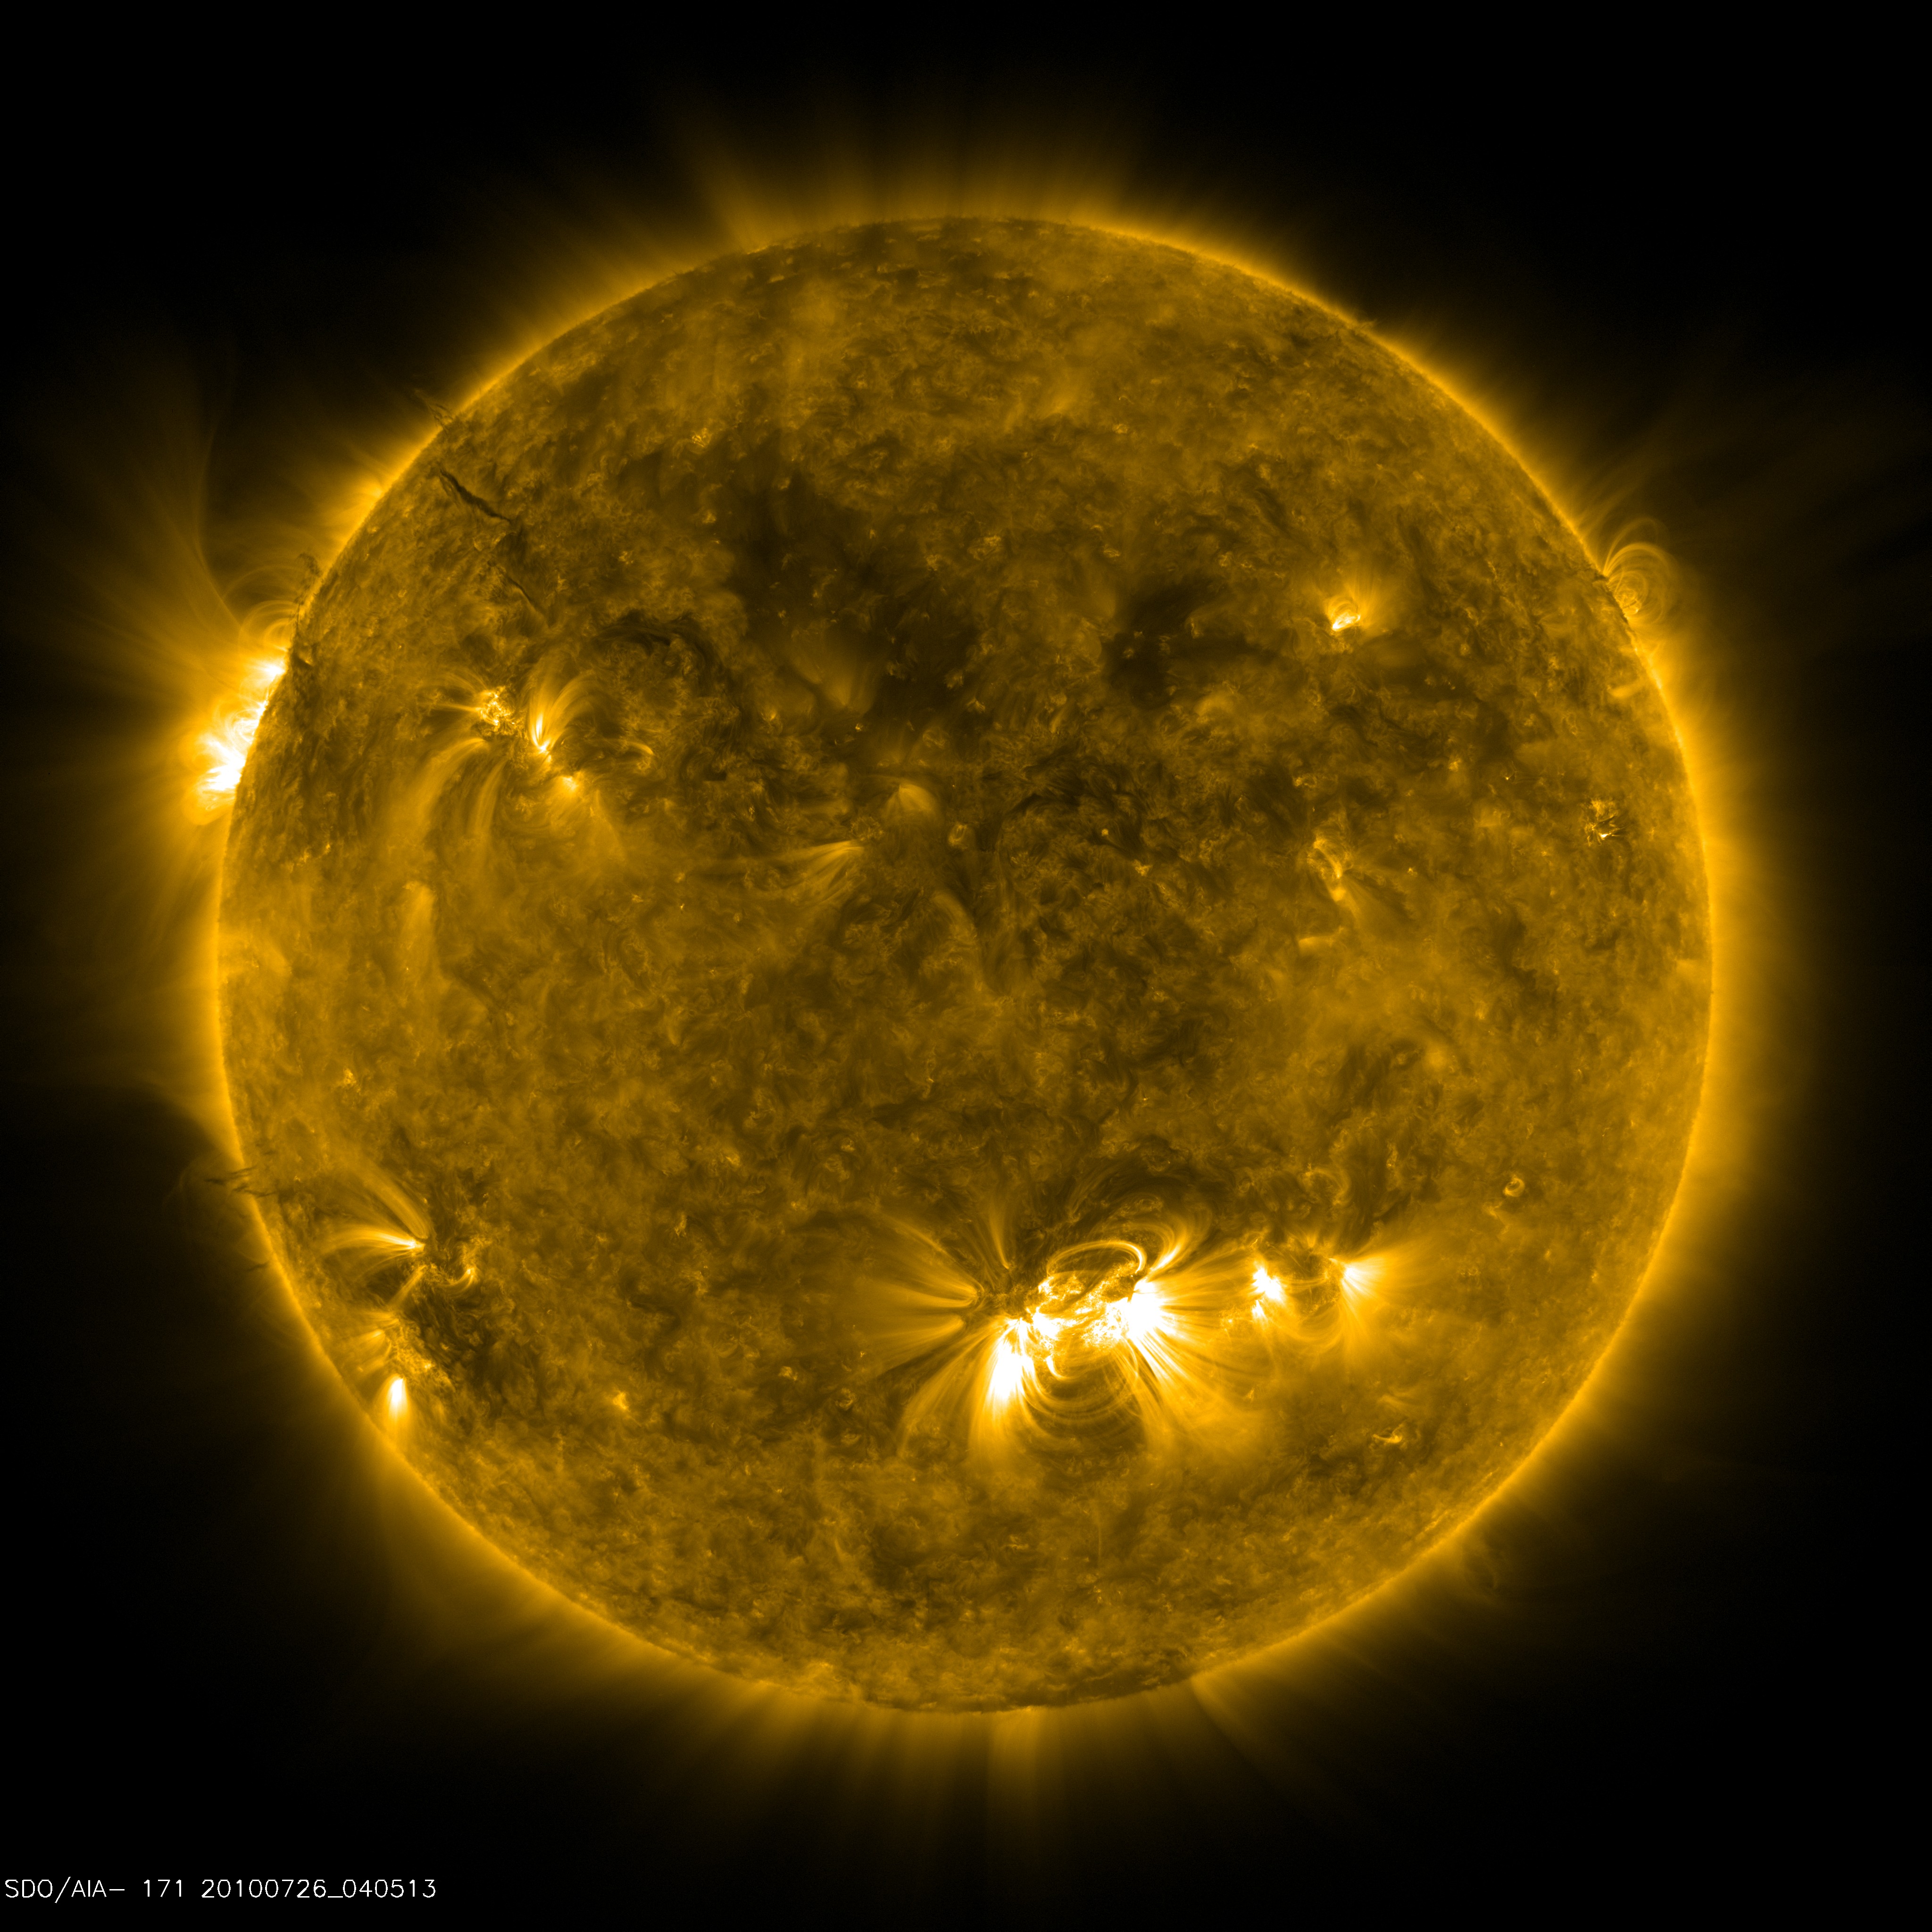
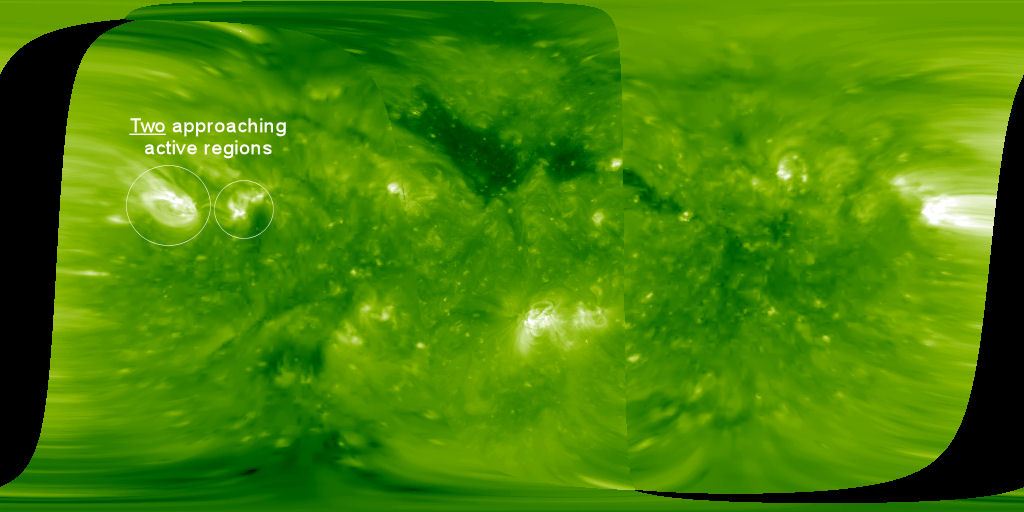
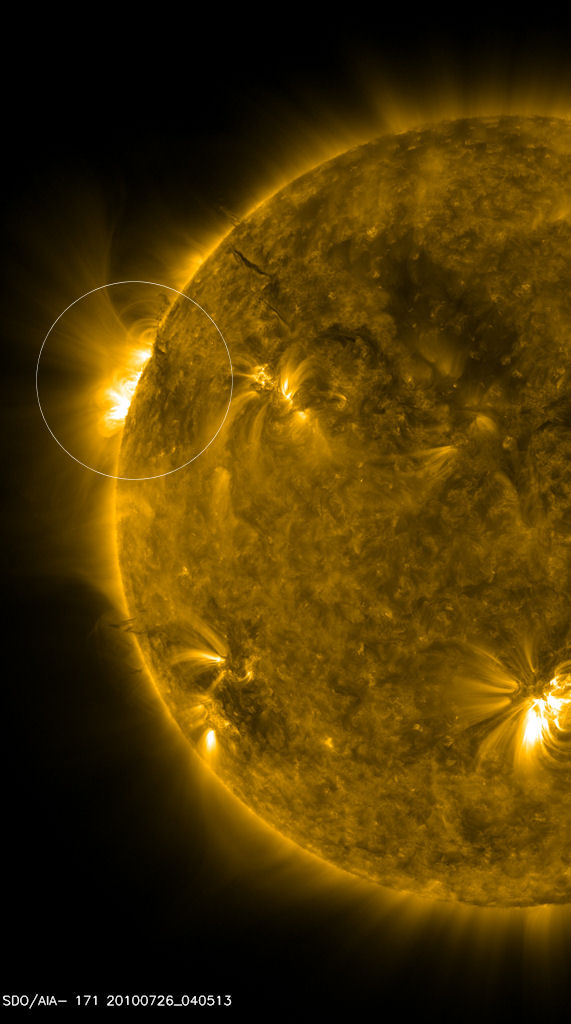
The CME, which can be seen here in pictures taken by one of the STEREO craft, was a release of hot, relatively dense plasma from the Sun. This added to the normal flow of matter that expands away from the solar surface, much as any gas expands when heated, called the solar wind. The solar wind, being a plasma not a gas, also has to obey magnetohydrodynamics – which just means, it has to deal with electromagnetic forces on top of all the stuff normal gases have to deal with. It carries with it an imprint of the magnetic field of the Sun present at the moment of departure, much like the magnetic imprint on the seabed of the Earth, caused by magnetic sensitive materials lining up to the Earth’s field.
The Earth protects itself with its own magnetic field, generated by convection in the outer core, which sees iron rising and falling, generating electric currents and therefore magnetic fields. The Earth also has its own plasma within that field, created by ionising sunlight and other radiation hitting our atmosphere. The meeting of the solar wind plasma and interplanetary magnetic field (imf) and the terrestrial plasma and magnetic field sees the Earth’s field pushed closer to the ground on the sunward side where the solar wind is flowing towards and exerting greatest pressure on. At the back, the tail in the wake of the pressure extends outward, leaving a windsock like appearance to the region under the control of Earth’s field (the magnetosphere). If the solar wind changes to a lower pressure, the windsock can extend further, if the wind exerts higher pressure, it can be curtailed. This curtailment sees plasma raced back towards the Earth and accelerated through a number of processes that lead to the aurora.
The CME represented a region of suddenly high relative pressure. As soon as it was seen (and there’s a website to help spot things like this), the alert was on for what would happen when it arrived. A planned space station spacewalk was forced to take into account increased radiation exposure. On the ground, the papers warned of aurorae and when the 1st of August CME struck the Earth on the 3rd, the skies did indeed light up, photographed as far south as Germany. The website spaceweather.com holds a rolling gallery of auroral pictures. It also shows a number of indices that are supposed to help you predict what would happen.
As explained in this thread on the forum of the Sky at Night Magazine, there are a number of auroral activity proxies (actually monitors of geomagnetic disturbances, which are the conditions aurorae most normally happen in). The first is the Kp Index, which is derived from magnetometers around the world giving a 0-9 planetary measure of ‘K’ the amount that geomagnetic activity is disturbing fields on the ground. A Kp index of roughly 5.33 would see an aurora on the horizon of Kendal (see here for your area). 7.33 would put it above and any higher would see the aurora noted south of Kendal as well (assuming all disturbances are equal, which they’re not).
The second is satellite data measuring the properties of the IMF, the field carried by the solar wind. If it points southward (negative Bz, or the yellow line going beneath the white line of the second graph on the website), it is able to connect to the magnetosphere more easily than if it is northwards. This implies a higher likelihood of disturbances high up leading to lights down here.
Finally, there is the actual pulse and flow of particles into the atmosphere as seen by satellites. The third website shows the ‘auroral oval’. In fact it is an extrapolation from various individual satellite flies. The data gathered from an individual pass is fed through a computer model of magnetic convection and an estimate for the rest of the cap comes out. If that oval touches the tip of Scotland (and is real) and the activity level (which comes from the actual particle flux measured by the satellite) is at 9 or 10, then it bodes well for an aurora.
I would add another website to their list, perhaps one with infrared satellite data showing the cloud distribution and how it is changing. So summarising:
Does the yellow line dip into negative territory?
Is the auroral oval touching Scotland with an activity level of 9 or above?
Do the clouds look like they’re out of your way or likely to be at some point?
If the answer to all four of these questions is yes, then there’s a heightened chance of auroral activity. But only increased.
Following the first wave of lights, it was noted that a second, slower wave was also headed Earthward and expected to hit sometime yesterday, on the 4th or the 5th. I stayed out for hours on the night of the 4th, staring at extremely clear skies having been clouded out on the 3rd. The answer to all four of the questions asked above was ‘yes’, but there wasn’t even a glimmer on the horizon. I did take photos on the off chance that there was something too faint to be visible, but nothing turned up in the viewfinder. I did see a few early Perseids though.
Then on the 5th, news that the CME had been a double event meant the papers picked it up with the Telegraph predicting aurora, amongst others, and the BBC explaining substorms, but with diagrams that showed an egg shaped rather than windsock magnetosphere. Unfortunately, it appears the second wave hit around mid-day, providing Southern Lights, but nothing for the north. By the time night fell here, the answer to each of the questions (with the possible exception for a short period of time of Kp) was no.


